Through the dashboard, you have an instant overview of contact moments and campaigns that can / should be sent, results and data information. A dashboard is set up on the brand or organisation you are associated with.
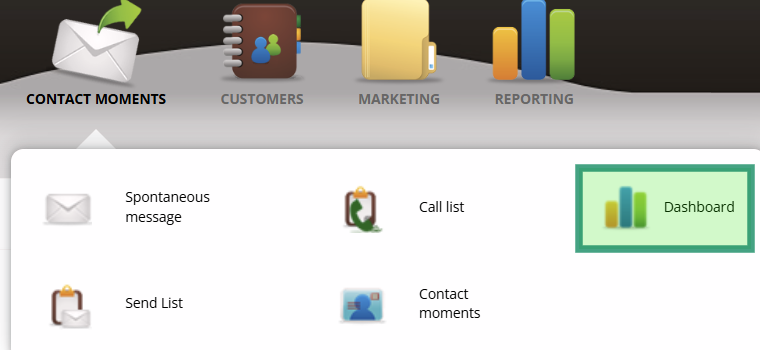
Select 'Dashboard'
Contact moments
To be sent:
These are the number of contact moments that are currently ready to be sent in the mailing list. Click on them and you will immediately see which contact moments and customers they are.
To call:
Here are the number of call moments that are currently relevant. Click on it and you will see the call moments and the customers.

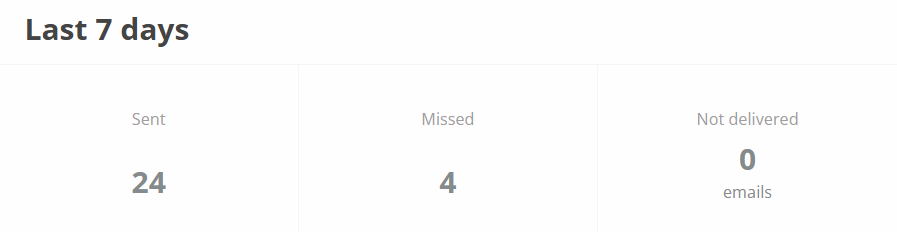
Last 7 days
Sent:
These are the number of contact moments sent by e-mail, SMS or card in the last 7 days. Click on it and you can view the statistics.
Missed:
Here you will find the number of contact moments that could or should have been sent or called in the last 7 days but are no longer relevant today because they no longer meet the criteria as set. Click on it to see which moments have been missed.
Not delivered:
The number of e-mail messages that could not be delivered to the customer's mailbox. Click on it to see which contact moment it concerns. These undelivered messages can also be found in the call list.
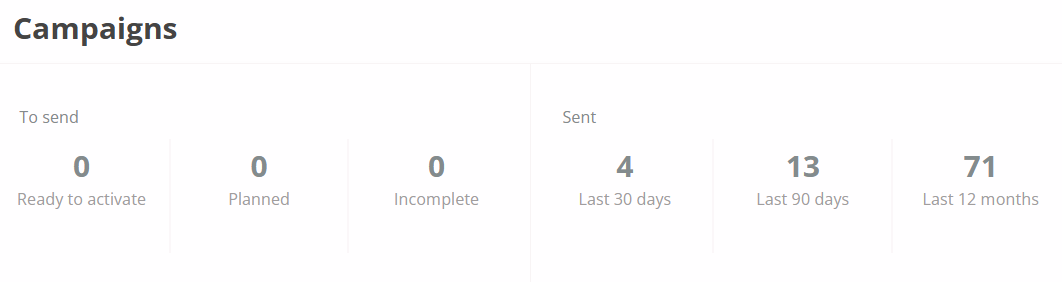
Campaigns
To be sent:
The number of campaigns ready to activate or scheduled for sending and the number of campaigns not yet complete for sending. Clicking takes you to the marketing calendar where the campaigns can be seen.
Sent:
The number of campaigns sent in the last 30 days, 90 days and the last year. Clicking on it will take you to the campaign section.
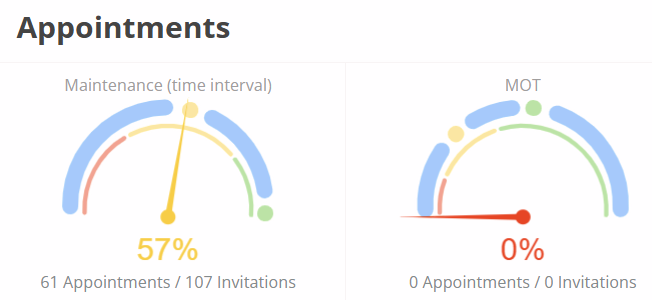
Appointments
This dashboard element shows how many appointments have been made in response to invitations sent for maintenance (based on time interval) and for MOT inspection or technical inspection.
The measurement is done on the number of appointments made compared to the invitation trajectories between three and six months old. It is a quarterly measurement.
The average score, is the score measured among all companies connected to the Contact module.
The average scores on MOT reminders sent seem to be on the low side but this is due to the fact that reminders are also sent to lost customers.
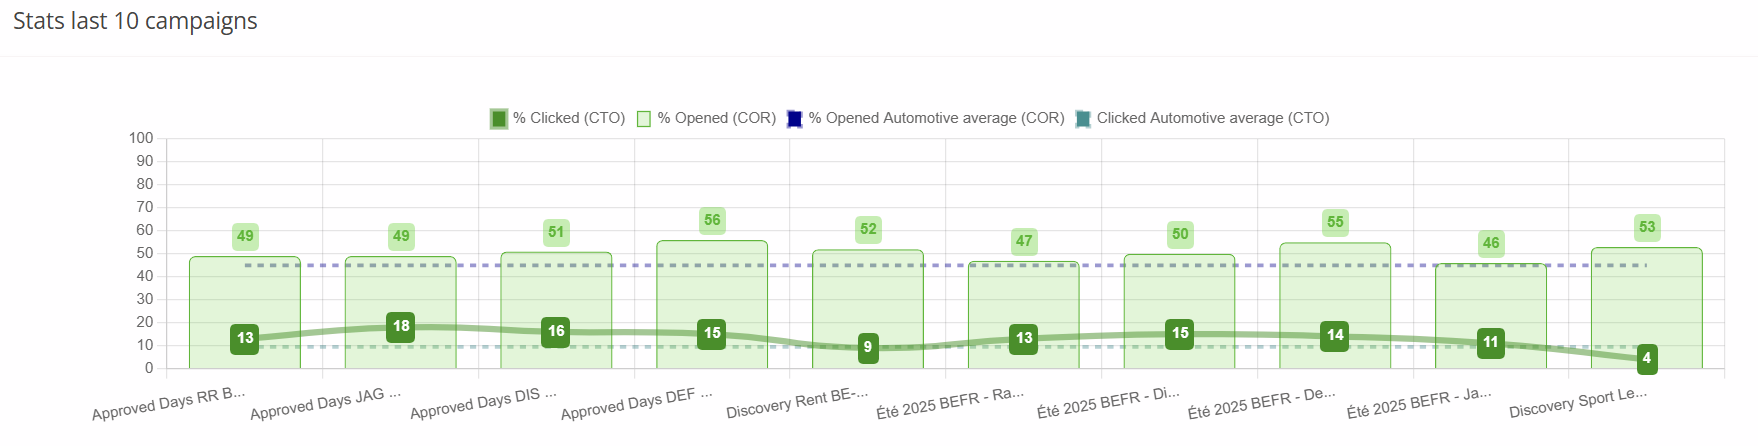
Statistics last 10 campaigns
This chart shows the last 10 campaigns sent with
- the opening score of the mail messages
- a measured click relative to opened messages
- the average opening score in the automotive sector
- the average measured click relative to posts opened in the automotive industry
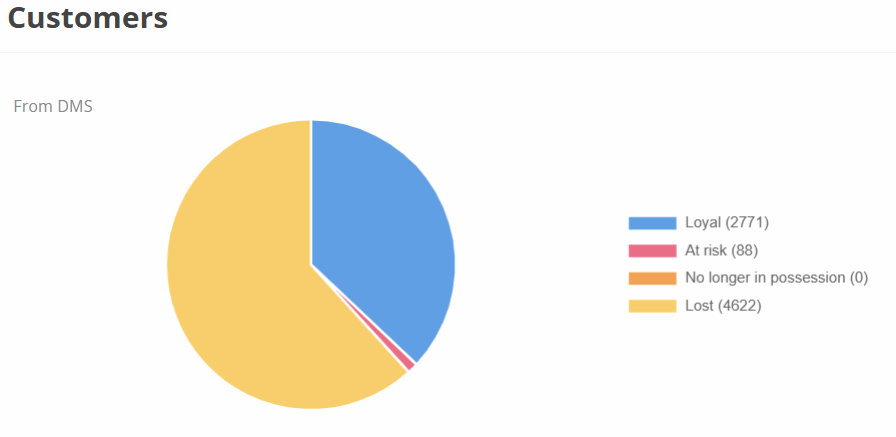
Customers
The chart shows how many customer lines were delivered from the DMS. The customer/car combinations were assessed and classified into four categories:
- loyal
All cars still in the workshop no later than 2 months after the predicted service date. - at risk
All cars that are between 2 months and 6 months overdue on predicted maintenance. - no longer in possession
All cars identified through third-party sources as no longer linked to the customer as recorded in the DMS. - lost
All cars at least 6 months overdue for maintenance based on time interval.
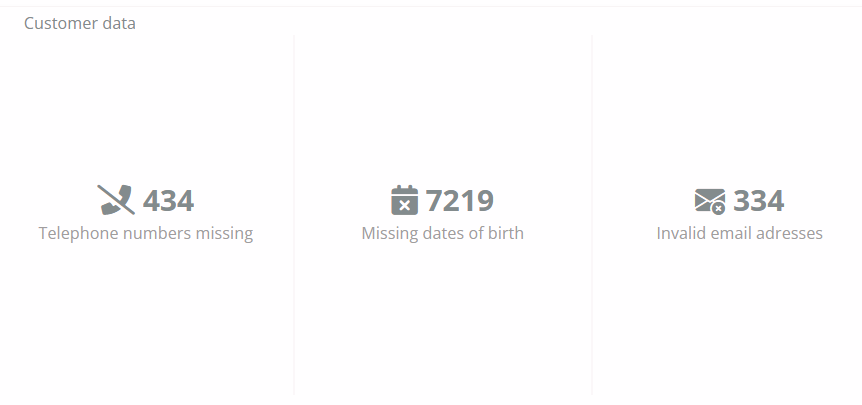
Customer data
The number of customers with a missing phone number, date of birth and whose e-mail address is not valid. Clicking on the number will take you to a section with more information.
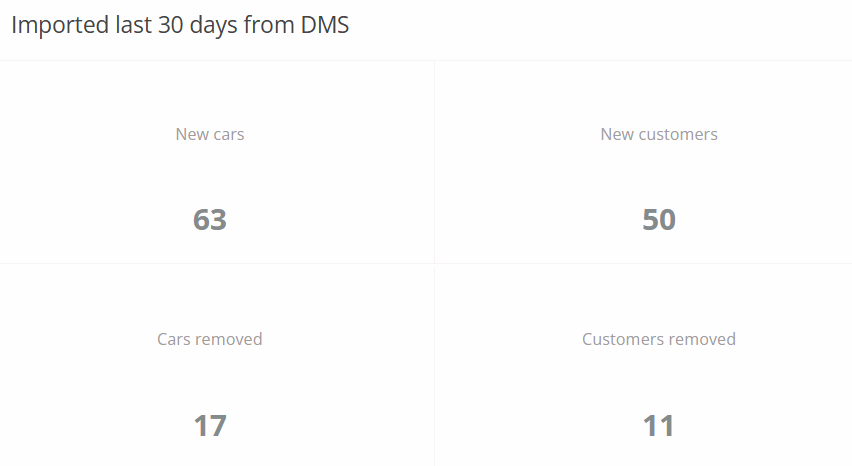
Last 30 days imported from DMS
This view shows how many new cars and customers have been added and removed in the last 30 days. Source of this is the DMS data export received and processed daily.
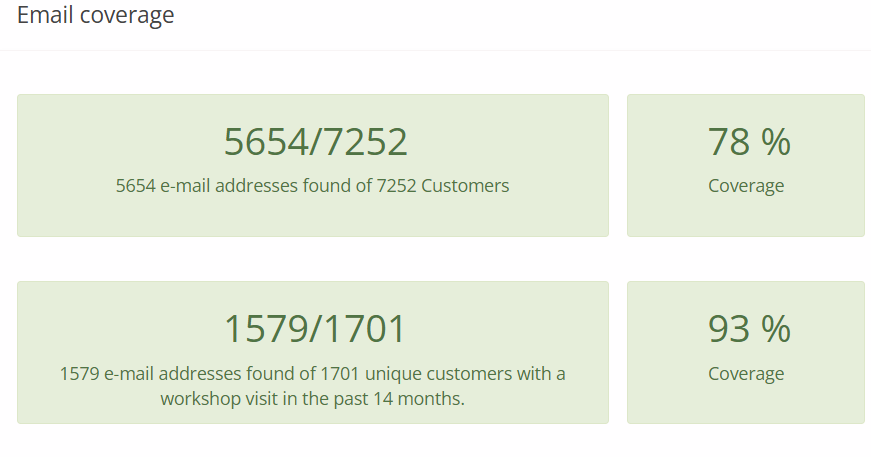
Email coverage
An e-mail address is an important data field for communicating with your customers. The coverage of e-mail addresses is shown in the overview in two categories:
- the number of e-mail addresses found compared to the total DMS file
- The number of e-mail addresses found relative to the number of unique visits in the last 14 months.
Tip! There are options to increase coverage without consuming energy. Contact MFX to discuss the possibilities.